

Consider your office environment for some time. You will find a small number of staff who excel in their work, many average-performing people, and a few low-performing people. The interesting fact is that it can be explained using a statistical principle called the bell curve.
Over time, the bell curve has become the most talked-about technique used for evaluating employee performance and performance management. Companies employ it for performance measurement and employee assessment. On the other hand, many companies question whether it still holds significance in today’s organizational environment.
Currently, HR management software and HRMS solutions are integrating the bell curve method with live performance measurement to provide a data-driven approach.
In this blog, we explain the concept of the bell curve, its meaning, use, advantages, limitations, and application in employee performance appraisal.
What Is a Bell Curve?
The bell curve is a graphical representation that is symmetrical. This graph looks like a bell, hence the name ‘bell curve.’
In statistics, a bell curve illustrates the distribution of various data points. In this case, most values are plotted in the middle area, while a few others appear at the top and bottom ends.
The bell curve is commonly used in:
- Statistics
- Employee performance evaluation
- Education grading
- Psychological assessment tests
- Market surveys
- Performance management
- Human resources analytics
Bell Curve Formula:
Where: f(x)
- f(x)= Probability density function value (height of the curve)
- μ (mu) = Mean or average value
- σ (sigma) = Standard deviation
- π (pi) = Mathematical constant (3.141)
- e = Euler’s number (2.718)
- x = Data point
This formula helps calculate the probability distribution of values in a dataset.
Components of the Bell Curve
To understand the bell curve better, let’s break down its major components.
1. Mean
Mean refers to the average of all the values. In the bell curve, the mean is found at the center point.
In case the average performance score of employees is 75, then the center of the bell curve would be 75.
2. Standard Deviation
This refers to the spread of all values relative to the average.
High Standard Deviation = Widely spread
Low Standard Deviation = Values clustered together
Standard deviation is a very important aspect when evaluating employee performance.
3. Distribution
The bell curve shows the distribution of performance scores among employees.
In most cases,
- Most employees are found in the middle
- Very few are exceptionally good performers
- Very few are poor performers
4. Symmetry
Normal distributions have symmetry; that means that the two parts of the curve mirror each other.
What Are the Key Characteristics of the Bell Curve?
The bell curve has various unique characteristics that make it valuable in statistics and HR appraisal systems.
1. Symmetric Shape
The curve is perfectly balanced around the mean.
2. Mean, Median, and Mode Are the Same
For a normal distribution:
Mean = Median = Mode
Hence, central tendency is maintained.
3. Most Values Lie Near the Mean
Most of the data points lie around the mean.
4. Tapered Ends
The tails of the distribution are thin, indicating fewer extreme values.
5. Standard Deviation Measures Variability
The larger the spread of the curve, the higher the variability.
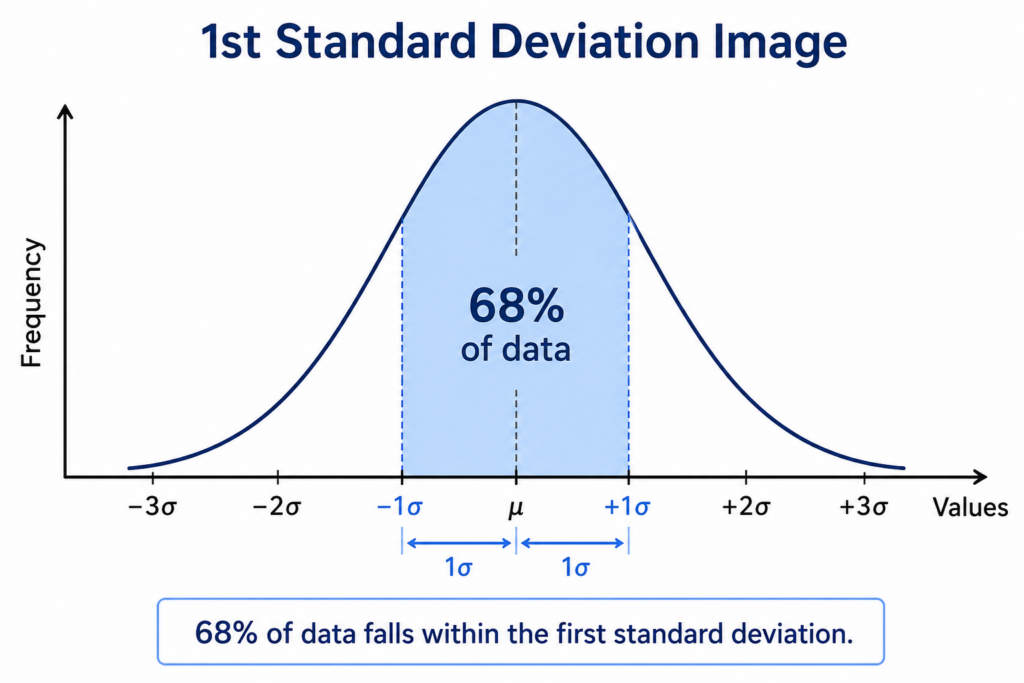
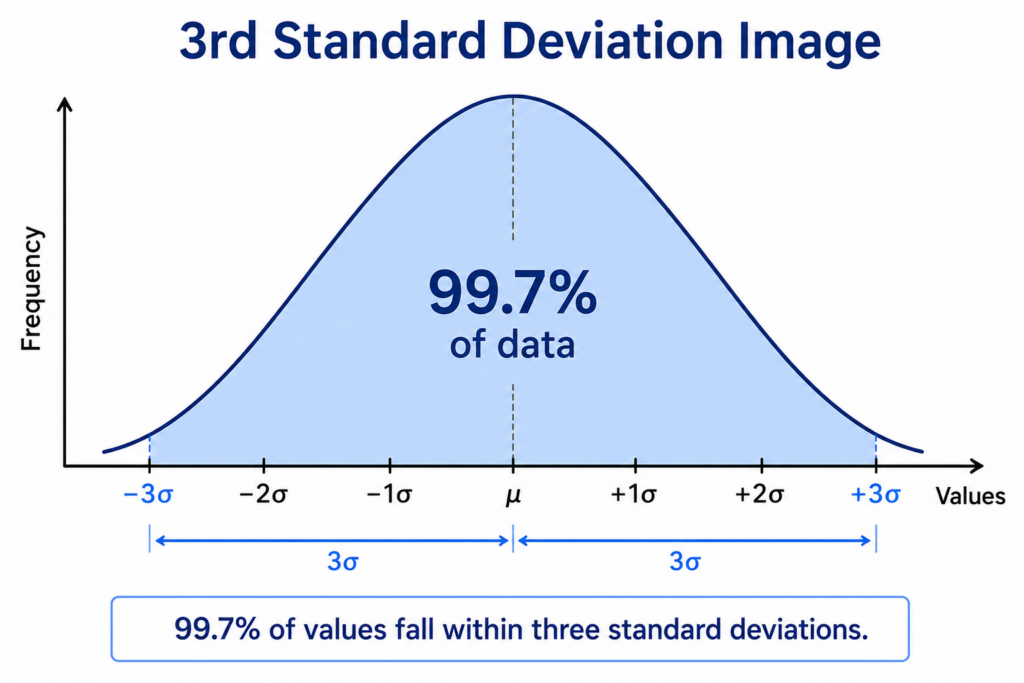
6. Predictable Percentage Distribution
The normal distribution obeys the well-known empirical rule:
- Within 1 standard deviation: 68% of data points
- Within 2 standard deviations: 95% of data points
- Within 3 standard deviations: 99.7% of data points
What Are the Applications of the Bell Curve?
The bell curve is largely used across industries because it helps organizations understand data patterns and make informed decisions.
1. Employee Performance Appraisal
The bell curve assists organizations in grouping their employees according to performance levels to help managers determine outstanding employees, ordinary employees, and those who need assistance or improvement.
2. Recruitment and Talent Assessment
Recruiters can assess and rank applicant scores using bell curve analysis to select candidates that exhibit strong competence and skills for specific positions.
3. Academic Grading
Educators can use normal distribution to rate students’ academic performance and classify them as excellent, poor, or ordinary to ensure consistent evaluation standards.
4. Market Research
Bell curve analysis helps businesses study consumer behaviors, purchasing patterns, and other market trends to facilitate decision-making and improve marketing approaches.
5. Financial Analysis
Financial analysts can evaluate investment risks, financial markets, and the probability of gaining profits based on bell curve statistics.
6. Quality Control
Manufacturers can use bell curve distribution to test the quality of products, control defects, ensure high-quality standards, and maintain consistency during production processes.
7. Healthcare Research
Medical researchers can examine patient data, analyze diseases, evaluate medical treatments, and investigate healthcare trends using normal distribution.
What is the Bell Curve in Performance Appraisal?
Bell curve in performance appraisal is an approach that classifies employee performance into specific groups in a performance appraisal process.
It is also referred to as forced ranking, whereby managers allocate their employees into different performance groups.
A general bell curve performance ranking is shown below:
- High Performers: 10%
- Moderate Performers: 70%
- Low Performers: 20%
Bell curve in performance appraisal has several advantages, including:
- Identifying high-performing employees
- Recognizing top-performing employees
- Enhancing overall workforce productivity
- Dealing with underperforming employees
- Developing balanced employee performance evaluation systems
In an ordinary process of HR appraisals, supervisors have to rate their employees’ performances. Rather than giving everyone the same rating, the bell curve ensures that employees’ performance ratings are spread out properly.
It avoids what is called performance rating inflation, where all employees are rated highly.
Example:
Where 100 employees are working for the organization:
- 10 employees can be classified as ‘outstanding performers.’
- 70 employees are considered ‘average performers.’
- 20 employees are ‘performers requiring improvement.’
This structure allows organizations to align rewards, promotions, and training programs more effectively.
What Are the Basics of the Bell Curve in Performance Appraisal?
Understanding the fundamentals of bell curve appraisal is important for effective performance management.
1. Employee Ranking
Through the use of the bell curve, employees’ ranking is done depending on their performance scores. With this technique, companies are able to know the best-performing individuals, the average-performing ones, and those who might need improvement programs.
2. Relative Evaluation
This model is relevant in the sense that it involves comparing employees instead of evaluating each employee individually. The relative appraisal process can help organizations develop balanced and competitive appraisal systems.
3. Fixed Distribution
Most organizations using this technique usually apply the fixed distribution process. Under this system, managers must distribute employees in terms of their performance in predefined categories of performance.
4. Performance Categories
Employees under the bell curve are normally classified into different performance categories like Excellent, Good, Average, Below Average, and Poor, among others. It assists organizations in making decisions regarding awards, promotions, and training, among others.
5. Data-Driven Decision Making
The bell curve method involves an objective assessment of HR decisions based on statistical analysis of employees’ performances.
How the Bell Curve Works in Performance Appraisal?
Here is a breakdown of the procedure.
Step 1: Set Performance Metrics
Organizations begin by defining performance metrics like:
- Productivity
- Goal setting
- Team spirit
- Attendance
- Leadership
- Communication
Step 2: Evaluate Employees
HR professionals analyze employee performance using HR technology or performance management software.
Step 3: Assign Scores
Performance grades are given to employees according to the evaluation criteria.
Step 4: Create Distribution
The data is represented on a bell curve.
The majority of employees belong to the average group, whereas there are a few employees at both extremes.
Step 5: Final Categorization
Classification categories may include:
- Top performers
- Average performers
- Underperformers
Step 6: HR Decisions
The information can be used to inform decisions related to:
- Promotions
- Incentives
- Training courses
- Improvement strategies
- Succession planning
What Are the Best Practices for Using the Bell Curve?
While the bell curve can improve performance management, organizations must use it carefully.
Here are some best practices.
1. Use Clear Evaluation Criteria
Employers should establish clear criteria that will make employees understand what the evaluation criteria and goals include and how their performance ratings are assessed.
2. Use Clear Evaluation Criteria
Don’t use just numeric indicators, but also involve such aspects as:
- Manager feedback
- Peer assessment
- Self-assessment
- Achieving goals
3. Avoid Forced Ranking Abuse
Forced ranking must be used cautiously in order to avoid inappropriate employee classification, unnecessary work stress, lower morale, and conflicts between colleagues within a company.
4. Train Managers Properly
It is important to provide managers with the proper training in order to assess their employees adequately, limit their biases, and conduct the process consistently.
5. Use HRMS and HR Software
Nowadays, the application of HRMS and HR software eases the process of conducting appraisals and managing employees’ performance, which makes it easier and more accurate.
6. Focus on Employee Development
Performance appraisals must contribute to employees’ development, help them gain skills, and advance their careers rather than cause fear and create a negative atmosphere at work.
7. Review the System Regularly
Regular revision of the performance management system helps maintain its quality and effectiveness, and adjust it to changing conditions in order to satisfy all parties involved.
Advantages of the Bell Curve in Performance Appraisal
The bell curve offers several benefits when implemented correctly.
1. Improves Performance Evaluation
The bell curve approach helps organizations to develop a systematic strategy for evaluating the performance levels of their employees.
2. Identifies Top Performers
Companies can quickly identify top-performing employees in order to promote them, reward them, incentivize them, make them leaders, and offer other career advancement opportunities to them.
3. Encourages Fair Distribution
It allows for systematic distribution of ratings among all the employees and prevents managers from rating all their employees as good or poor performers.
4. Supports Data-Driven Decisions
Appraisal of employees’ performances becomes highly objective because decisions are made based on statistical facts and performance numbers of employees.
5. Reduces Personal Bias
Making use of performance data and fixed ratings minimizes the chances of developing favoritism and subjectivity while evaluating employees’ performances.
6. Helps in Employee Development
Bell curve analysis assists organizations in identifying underperforming employees and providing them with relevant training to improve their performance.
7. Enhances Workforce Planning
Through bell curve analysis, organizations can effectively manage their workforces in terms of succession plans, talent management, and employee retention.
Common Challenges of the Bell Curve in Performance Appraisal
Despite its advantages, the bell curve also has some limitations.
| Challenge | Description |
| Forced Ranking Issues | Employees may be unfairly categorized despite good overall performance. |
| Reduces Employee Morale | Low ratings can decrease employee motivation and job satisfaction. |
| Encourages Unhealthy Competition | Employees may compete instead of collaborating with teammates. |
| Possibility of Manager Bias | Personal bias can still affect appraisal decisions and ratings. |
| Ignores Individual Growth | Employee improvement and creativity may sometimes be overlooked. |
| Creates Workplace Stress | Continuous comparison can increase employee stress and pressure. |
| Not Suitable for Every Organization | The method may not fit all workplace cultures or business models. |
How HRMS Software Helps in Bell Curve Performance Appraisal?
Modern HRMS technology makes the process of performance management much easier.
Using modern HR tools, one can:
- Automate employee assessment
- Prepare bell curve charts quickly
- Monitor performance trends
- Minimize mistakes
- Enhance visibility
- Provide constant feedback
- Design objective-based appraisal processes
HRMS is a tool that allows managers to concentrate on the development of employees and not waste time on confusing calculations.
Conclusion
The bell curve is still among the most commonly applied techniques in performance appraisals and employee performance management. If properly executed, the bell curve technique will enable organizations to easily identify their high-performing employees, enhance the accuracy of the evaluation process, and support workforce planning. However, companies have to find a balance between statistical analysis and the development of employees.
In this era of advanced HR management software such as Savvy HRMS, organizations can simplify the entire performance management process through automated appraisals, real-time monitoring of employee activities, intelligent data analytics, and a more transparent evaluation system. With Savvy HRMS, companies can make informed HR decisions and boost employee productivity.
Ready to make performance appraisals smarter, faster, and more transparent? Empower your workforce with Savvy HRMS today.
Book a Demo TodayFAQ
1. What does the bell curve tell us?
The bell curve shows how data or performance is distributed within a group. It indicates that most values fall near the average, while only a few are extremely high or low. In employee performance appraisal, it helps organizations identify top performers, average performers, and underperformers.
2. What is the bell curve theory?
The bell curve theory is based on the normal distribution in statistics. It explains that data points are naturally distributed around a central average value, forming a symmetrical bell-shaped graph. This theory is widely used in performance management, education, finance, and market analysis.
3. What is the bell curve method?
The bell curve method is a performance evaluation technique used to categorize employees into different performance groups. Organizations generally classify employees as high performers, average performers, and low performers to ensure balanced and fair performance appraisal.
4. What is the 68%-95%-99.7% rule?
The 68%-95%-99.7% rule, also known as the empirical rule, explains data distribution in a normal bell curve:
– Around 68% of values fall within 1 standard deviation from the mean.
– Around 95% fall within 2 standard deviations.
– Around 99.7% fall within 3 standard deviations.
This rule helps organizations and analysts understand variability and performance distribution more accurately.