What Is an MIS Report? Meaning, Types, Format, Examples & How to Prepare One


-
AuthorSalilendra Kumar
-
 Last Updated
November 06, 2026
-
 Reading Time
16 Mins
TL;DR
Want to understand how businesses use data to make better decisions? Here is a quick overview of MIS reports:
- MIS report meaning: An MIS report is a structured document that organizes business data to help managers monitor performance and make decisions.
- Purpose: It helps track business activities, measure performance, identify trends and find areas that need improvement.
- Types: Common types include summary, operational, financial, sales, inventory, HR, exception and ad hoc reports.
- Format: A typical MIS report includes a report title, reporting period, KPIs, data tables, performance comparisons and key observations.
- Examples: HR, sales, finance and inventory reports help businesses monitor department-specific activities.
- Preparation: Businesses can create MIS reports using Excel, Google Sheets, reporting tools or integrated management software.
Businesses generate a large amount of information every day, from employee attendance and payroll expenses to sales performance and operational activities. However, collecting data is not enough as organizations also need to organize, analyze and present this information to understand how different departments are performing.
This is where Management Information System (MIS) reports become useful. They help businesses convert raw data into structured information that managers can use to monitor performance, identify problems and make informed decisions.
In this guide, we will explain what an MIS report is, its different types, essential components, formats, practical examples and how to prepare one using Excel.
What Is an MIS Report?
MIS stands for Management Information System. It is a structured document that presents relevant business information in an organized format to help managers monitor operations, evaluate performance and make informed decisions.
It collects data from different business activities and converts it into meaningful information through tables, charts, summaries and performance indicators.
Who Uses MIS Reports in an Organization?
Different departments use MIS reports according to their operational and reporting requirements.
| Department | Information tracked |
| HR | Employee headcount, attendance, leave, recruitment and attrition |
| Finance | Revenue, expenses, budgets, cash flow and financial performance |
| Sales | Sales targets, revenue, leads and conversions |
| Operations | Production, productivity, order processing and workflow efficiency |
| Inventory | Stock levels, inventory movement and reorder requirements |
| Management | Overall business performance, departmental KPIs and operational trends |
Why Are MIS Reports Important for Businesses?
MIS reports help businesses to track activities across different departments and check whether they are meeting their goals. They bring important information together so managers can understand performance, identify problems and make better decisions.
You can explore how MIS reports play an important role in today’s business, as defined below:
1. Helps Make Better Business Decisions
MIS reports provide information about sales, expenses, employees and daily activities. This information helps managers make decisions based on actual business performance rather than guesswork.
2. Tracks Business Performance
MIS reports help managers compare actual results with business targets. They can check key performance indicators (KPIs), review departmental progress and find areas that need improvement.
3. Improves Daily Operations
These reports help identify delays, repeated problems and gaps in daily activities. Managers can use these details to fix issues and make work processes more efficient.
4. Identifies Trends and Performance Gaps
Comparing reports from different periods helps businesses spot changes and patterns. For example, an attendance report can show whether employee absenteeism is increasing in a particular department.
5. Supports Financial Planning and Budgeting
Finance teams use MIS reports to track income and budgets. Comparing actual spending with planned budgets helps businesses to manage costs and plan future expenses.
6. Improves Accountability Across Departments
Department-wise reports help managers check team progress and responsibilities. For example, recruitment reports show open positions, completed interviews and successful hires which helps managers to track hiring activities.
How Do MIS Reports Work?
MIS reports follow a step-by-step process that turns raw business data into useful information. Although the process may vary between organizations, it generally involves six stages.
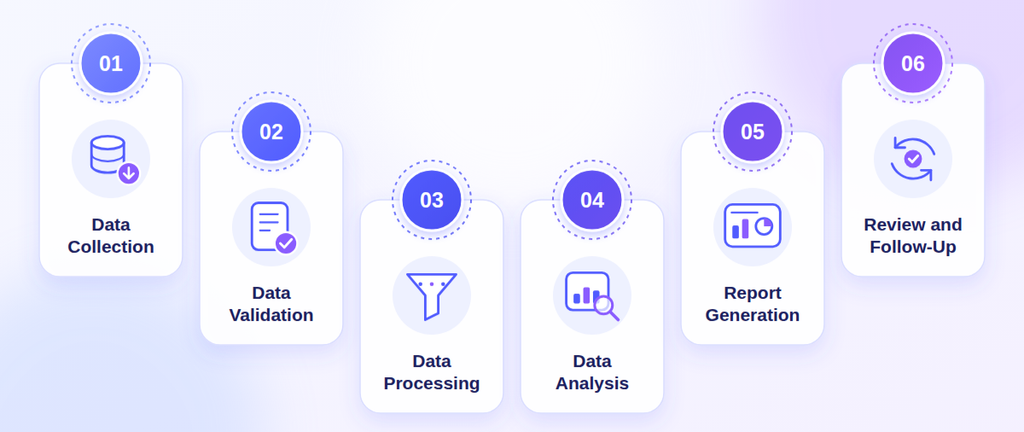
1. Data Collection
Relevant information is collected from different departments using spreadsheets, HRMS, ERP, payroll, CRM and accounting systems. For example, Core HR teams collect employee details, attendance, leave and recruitment records.
2. Data Validation
The collected data is checked for accuracy and completeness which includes finding duplicate entries, missing details and incorrect values. HR teams may verify employee IDs and attendance records before preparing reports.
3. Data Processing
The validated information is organized according to reporting needs as records may be grouped by department, location, employee category or reporting period.
4. Data Analysis
The organized data is reviewed to identify patterns and calculate performance indicators. For example, HR teams may calculate attrition rates, attendance percentages and recruitment conversion rates.
5. Report Generation
After data analysis, the data is represented through tables, charts, graphs or dashboards which makes the information easier for managers to understand and compare.
6. Review and Follow-Up
Managers review the report, identify gaps and decide on corrective actions. For example, higher employee attrition may encourage management to investigate its causes and improve retention initiatives.
What Are the Different Types of MIS Reports?
Businesses use different types of MIS reports to track performance and monitor activities across departments. Some reports provide an overall business overview, while others focus on specific areas such as finance, sales, HR and inventory.
Here are eight commonly used types of MIS reports.
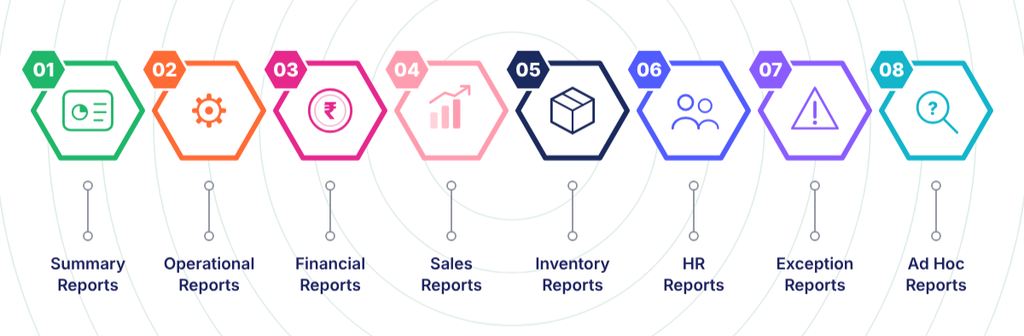
1. Summary Reports
Summary MIS reports give managers an overview of business performance during a specific period. They bring important information together, making it easier to review results without going through individual records.
What does it include?
- Total revenue and expenses.
- Department-wise performance.
- Key performance indicators (KPIs).
- Major achievements and performance gaps.
Who uses it?
Senior management, business owners and department heads..
2. Operational Reports
Operational MIS reports help managers to monitor daily business activities and identify delays or issues that may affect operations.
What does it include?
- Daily production figures.
- Order processing status.
- Employee shift activities.
- Pending tasks and operational delays.
Who uses it?
Operations managers, supervisors and department heads.
3. Financial Reports
Financial MIS reports help businesses to monitor their financial position and track income, expenses and budgets.
What does it include?
- Revenue and expenditure.
- Cash flow.
- Accounts receivable and payable.
- Budget utilization and profitability.
Who uses it?
Finance managers, accountants, business owners and senior management.
4. Sales Reports
Sales MIS reports help businesses evaluate sales performance, track revenue and check progress against targets.
What does it include?
- Sales targets and achievements.
- Revenue generated.
- Leads received and converted.
- Product-wise and region-wise sales.
- Sales team performance.
Who uses it?
Sales managers, business development teams and senior management.
5. Inventory Reports
Inventory MIS reports help businesses to track available stock, monitor inventory movement and identify products that need replenishment. They are useful for manufacturing, retail and supply chain operations.
What does it include?
- Available stock and stock movement.
- Stock received and issued.
- Slow-moving and ageing inventory.
- Reorder levels and stock shortages.
Who uses it?
Inventory managers, warehouse supervisors, procurement teams and operations managers.
6. HR Reports
HR MIS reports help organizations to monitor employee information and review the performance of HR activities.
What does it include?
- Employee headcount and new joiners.
- Resignations and employee exits.
- Attendance and absenteeism.
- Leave utilization and recruitment progress.
- Payroll expenses and employee attrition.
Who uses it?
HR managers, HR executives, payroll teams and senior management.
7. Exception Reports
Exception MIS reports highlight unusual activities or results that fall outside expected limits. They help managers identify issues that may need immediate attention.
What does it include?
- Expenses exceeding approved budgets.
- Repeated attendance irregularities.
- Production delays.
- Inventory shortages.
- Missed performance targets.
- Unusual transactions.
Who uses it?
Department heads, operations managers, finance teams and senior management.
8. Ad Hoc Reports
Ad hoc MIS reports are prepared when managers need information for a specific question or business requirement. Unlike regular reports, they are generated as and when needed.
What does it include?
The information depends on the request. It may cover employee records, sales trends, departmental performance or financial comparisons.
Who uses it?
Managers, business analysts and department heads.
Comparison of Different Types of MIS Reports
Each MIS report serves a different purpose. The following table provides a quick comparison of the eight types.
| MIS report type | Main purpose | Example |
| Summary | Provides an overall performance overview | Monthly business summary |
| Operational | Tracks daily activities | Daily production report |
| Financial | Monitors financial performance | Monthly expense report |
| Sales | Tracks revenue and sales targets | Sales performance report |
| Inventory | Monitors stock availability and movement | Stock availability report |
| HR | Tracks workforce activities | Employee attendance report |
| Exception | Highlights unusual activities or deviations | Attendance deviation report |
| Ad hoc | Addresses specific information requests | Location-wise attrition analysis |
What Are the Key Components of an MIS Report?
An effective MIS report should present information in a structured and understandable format. Although the exact components depend on the type of report as most MIS reports contain the following elements.
1. Report Title and Reporting Period
Every report should have a clear title indicating what information it contains. It should also mention the reporting period, such as daily, weekly, monthly or quarterly.
For example: Monthly HR MIS Report – October 2026.
2. Executive Summary
An executive summary provides a brief overview of the most important information in the report. It highlights major performance indicators, achievements, issues and important observations.
This helps managers understand the report’s main findings without reviewing every data point.
3. Key Performance Indicators (KPIs)
KPIs are measurable indicators used to evaluate performance against specific business objectives.
For example, an HR MIS report may include:
- Employee headcount.
- Employee attrition rate.
- Average attendance percentage.
- Time to hire.
- Recruitment conversion rate.
4. Data Tables and Metrics
Data tables organize information into rows and columns, making it easier to review and compare different values.
For example, a sales report may include monthly revenue, sales targets, actual achievements and region-wise performance.
5. Targets and Actual Performance
This component compares expected results with actual performance.
For example, if a department has a monthly recruitment target of 20 employees but hires only 15, the report can highlight the difference.
6. Variance Analysis
Variance analysis identifies the difference between planned and actual results. It helps managers understand whether performance is above or below expectations.
For example:
Variance = Actual Value − Target Value
If the monthly sales target is ₹5,00,000 and actual sales are ₹4,50,000, the variance is -₹50,000.
7. Observations and Insights
This section explains what the reported figures indicate.
For example, a report may show that employee absenteeism increased compared with the previous month. The observation section can highlight the departments where the increase is most noticeable.
8. Recommendations and Action Items
An MIS report should help managers decide what needs attention. This section can include suggested corrective actions, responsible teams and expected completion dates.
For example, if attendance issues are increasing in one department, HR may recommend reviewing shift schedules and attendance records.
What Is the Standard MIS Report Format?
An MIS report format refers to the structure used to arrange and present business information.
There is no single format suitable for every organization. The layout depends on the type of information being tracked, the reporting period and the intended audience.
However, a standard MIS report generally includes:
| Component | Information included |
| Report heading | Report name and department |
| Reporting period | Daily, weekly, monthly or quarterly period |
| KPI summary | Important performance indicators |
| Data table | Detailed business information |
| Target vs actual | Comparison of planned and actual results |
| Variance | Difference between target and actual |
| Observations | Important findings and trends |
| Action items | Recommended next steps |
Sample MIS Report Format
Here is a sample monthly business MIS report:
| Particulars | Target | Actual | Previous month | Status |
| Revenue | ₹5,00,000 | ₹4,70,000 | ₹4,50,000 | Below target |
| Expenses | ₹2,00,000 | ₹1,85,000 | ₹1,90,000 | Within budget |
| New customers | 100 | 90 | 85 | Below target |
| Orders processed | 500 | 520 | 480 | Above target |
| Customer complaints | 20 | 15 | 18 | Improved |
Note: All figures are illustrative and provided only to demonstrate an MIS report format.
This format allows managers to compare current performance with targets and previous reporting periods.
The observations section can then explain why certain targets were missed or exceeded.
How to Make an MIS Report in Excel?
Excel is a useful tool for preparing MIS reports because it allows businesses to organize data, perform calculations and present information through tables and charts.
Follow these seven steps to create an MIS report in Excel.

Step 1: Identify the Purpose of the Report
Decide what information you want to track and why the report is needed. For example, an HR team may prepare a monthly MIS report to monitor employee headcount, attendance, leave and attrition.
Step 2: Collect and Enter the Required Data
Gather relevant information from spreadsheets, HRMS, payroll software or other business systems, then enter the data into an Excel worksheet using separate columns for details such as employee ID, department, attendance and reporting period.
Step 3: Organize and Clean the Data
Now remove duplicate records, check missing values and correct inconsistent entries. Use clear column headings and maintain a consistent data format to make the information easier to analyze.
Step 4: Apply Excel Formulas
Use Excel formulas to calculate important business metrics. For example, you can use SUM to calculate total expenses, COUNTIF to count specific entries and AVERAGE to calculate average attendance.
Step 5: Create PivotTables
Use PivotTables to summarize large datasets and compare information by department, location or reporting period. For example, an HR team can create a department-wise employee headcount summary.
Step 6: Add Charts and a Dashboard
Try to use bar charts, pie charts or line graphs to present important findings. You can also create a simple dashboard to display key performance indicators (KPIs) in one place.
Step 7: Review and Share the Report
Check formulas, figures and report headings before sharing the workbook with managers. Save the report and maintain previous versions to compare business performance over time.
What Are the Common Challenges in Preparing MIS Reports?
Preparing MIS reports can become difficult when business information is spread across different systems or depends heavily on manual processes.
Let’s see some common challenges organizations face when making MIS reports.
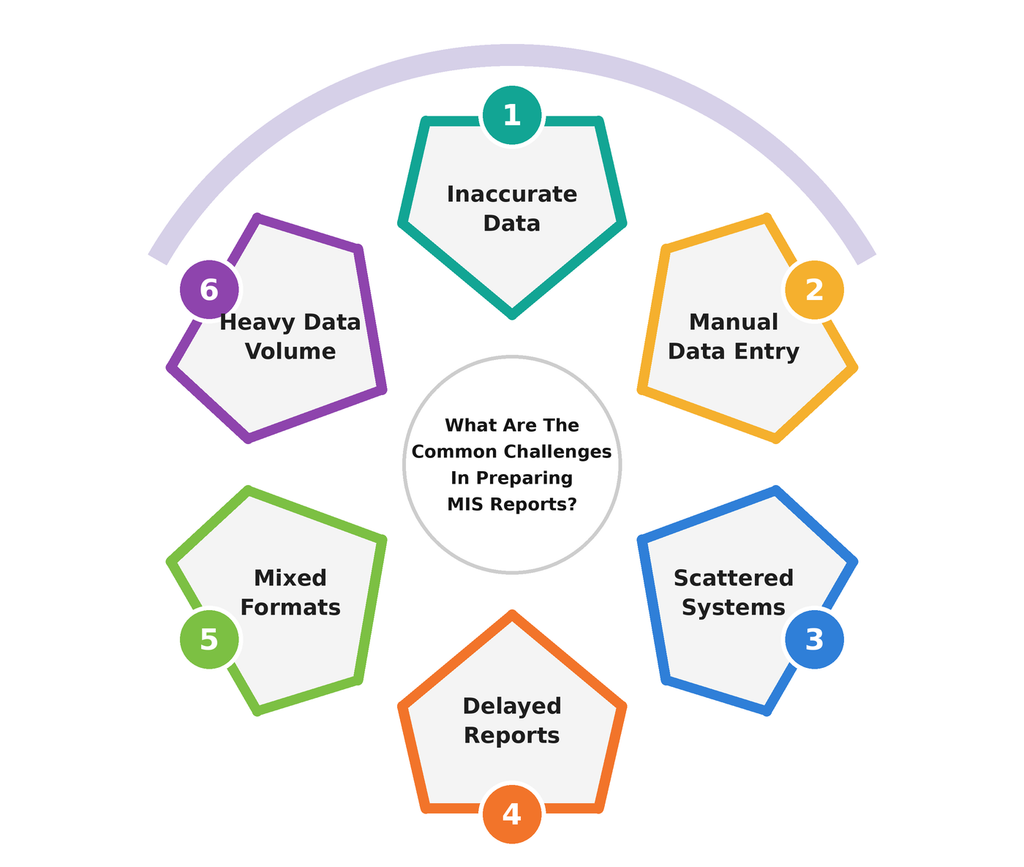
1. Inaccurate or Incomplete Data
MIS reports depend on accurate information. However, missing employee details, incorrect financial entries or duplicate records can affect the final report. Businesses need to check their data before using it for reporting.
2. Manual Data Collection and Entry
Collecting information from multiple spreadsheets and entering it manually takes time. It can also lead to duplicate entries, calculation mistakes and other errors.
3. Data Spread Across Multiple Systems
Different departments may use separate applications to manage their information.
For example, HR may use one system for employee records, another for attendance management and a separate platform for payroll.
Combining this information for reporting can become difficult without proper integration.
4. Delayed Report Generation
When reports depend on manual data collection and calculations, their preparation may take longer.
As a result, managers may receive information after the period in which they needed it.
5. Inconsistent Reporting Formats
Different departments may follow different spreadsheet formats, naming conventions and calculation methods.
This makes it difficult to compare information across departments or reporting periods.
6. Difficulty Analyzing Large Volumes of Data
As organizations grow, the amount of information they generate also increases.
Reviewing large spreadsheets manually can make it difficult to identify important trends and performance gaps.
How Can MIS Reporting Software Help Automate Reports?
Businesses can use MIS reporting software and integrated management systems to simplify data collection, analysis and report generation.
Instead of manually combining information from multiple spreadsheets, organizations can use connected systems to organize relevant data and generate reports.
Some useful capabilities include:
1. Automated Data Collection
Software can collect information from connected business applications and reduce repetitive manual data entry.
For example, an integrated HRMS may bring together employee information, attendance and leave records for HR reporting.
2. Centralized Information Management
A centralized system helps organizations to maintain relevant information in one place. This can make it easier for authorized teams to access and review data across different departments.
3. Real-Time Reporting and Dashboards
Depending on the software and its integrations, reports and dashboards can refresh as new information becomes available.
Managers can review important metrics without waiting for manually prepared summaries.
4. Automated KPI Calculations
Software can calculate predefined metrics such as employee headcount, attendance percentages and payroll expenses.
This reduces the need to repeat calculations manually for every reporting period.
5. Scheduled Report Generation
Some reporting systems allow users to schedule reports at regular intervals.
For example, HR teams may receive daily attendance summaries or monthly employee movement reports.
6. Access Controls and Data Security
Reporting software can provide role-based access controls so that employees and managers can view information relevant to their responsibilities.
This is particularly important when reports contain confidential employee or financial information.
Manual vs Automated MIS Reporting
Let’s understand the difference between manual and automated MIS reporting for a better overview:
| Manual MIS reporting | Automated MIS reporting |
| Relies heavily on manual data entry | Can collect data from connected systems |
| Requires repeated spreadsheet updates | Can refresh reports automatically |
| Calculations may need manual verification | Can apply predefined calculations |
| Combining information can take time | Can consolidate connected data |
| Report preparation depends on individuals | Can support scheduled report generation |
| Historical comparisons require manual organization | Can provide historical data comparisons |
The right approach depends on business size, reporting requirements, available technology and the complexity of operations.
What Are the Best Practices for Effective MIS Reporting?
Creating an MIS report is not just about collecting information and presenting it in a spreadsheet. The report should be accurate, relevant and easy to understand.
Follow these practices to improve the quality of MIS reporting.
- Use accurate and verified data: Check information for missing entries, duplicates and incorrect values before preparing reports.
- Focus on relevant KPIs: Include metrics that directly relate to the department’s objectives and management requirements.
- Maintain consistent reporting formats: Follow standard templates so that information can be compared across reporting periods.
- Choose the right reporting frequency: Prepare daily, weekly or monthly reports according to the nature of the information being monitored.
- Keep reports simple and readable: Use clear headings, organized tables and appropriate charts instead of overcrowding the report.
- Include actionable insights: Explain what the numbers indicate and highlight areas that require management attention.
- Review reports regularly: Check calculations, reporting methods and data sources to maintain consistency.
- Maintain appropriate data access controls: Restrict confidential business and employee information to authorized users.
Conclusion
Overall, MIS reports help organizations to turn business data into meaningful information that supports better planning, monitoring and decision-making. From tracking financial performance and sales activities to monitoring employee attendance and payroll, these reports provide managers with a structured view of business operations.
However, preparing useful MIS reports requires accurate data, relevant KPIs and consistent reporting practices. Using reporting tools and integrated management systems can help organizations simplify data collection, reduce repetitive work and improve access to important business information.

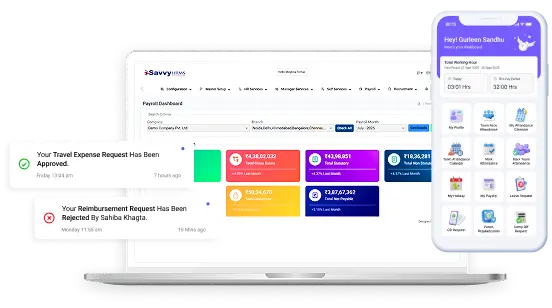


Make Business Reporting Easier with the Right HRMS
Frequently Asked Questions
1. What is the MIS report full form?
The MIS report full form is Management Information System, it presents organized business information to help managers monitor activities, evaluate performance, and make informed decisions.
2. What is the main purpose of an MIS report?
The main purpose of an MIS report is to convert business data into meaningful information. It helps organizations monitor performance, identify trends, evaluate operations and support management decisions.
3. What are the five main types of MIS reports?
Five commonly used types are summary reports, operational reports, financial reports, sales reports and HR reports. Other types include inventory, exception and ad hoc reports.
4. What is the difference between MIS and MIS reports?
MIS refers to the Management Information System used to collect, process, store and distribute information. MIS reports are structured outputs of that system that present relevant information for analysis and decision-making.
5. What should an MIS report include?
An MIS report generally includes a report title, reporting period, executive summary, key performance indicators, data tables, target comparisons, variance analysis, observations and recommendations.
6. How do I prepare an MIS report in Excel?
To prepare an MIS report in Excel, you need to create a workbook, add report headings, organize the required data into columns, apply formulas, analyze performance and present the results using tables, charts or PivotTables.